


Just like with human languages, there are also a number of languages the financial market speak, they are: Sentimental analysis, Fundamental analysis and Technical analysis. To understand how the financial markets work, learning how to speak and understand these languages is highly necessary. (when I first heard ibibio I was perplexed! “is this Nigerian Chinese?” I asked myself, then I imagined trying to read a book written in ibibio!)
For now, we’ll take a look at Technical analysis which focuses on studying and using past price movements (of digital currencies/assets) to understand current price movements and to further use the information gotten to determine and predict future price movements.
“Jesus, what’s with the ‘price movements’?” well, the price movements are as a result of the forces of demand and supply (I know, flow with me, I’ll explain)
When people demand for something, they usually buy that thing, and when they supply something, it usually means they sold it to someone else. Technical analysts believe that from time past, the records of people’s buying and selling habits form unique patterns that tends to repeat itself and if these patterns are studied properly, it can be used to determine and predict how and when people would buy/sell something but most importantly at what price this thing would be sold/bought.
Now, the first thing that comes to mind when one hears Technical analysis is;
TRADING CHARTS: The first time I saw a trading chart, half my brain cells died. How on earth could people read, understand and use this to somehow make money out of thin air? I had plotted some economic graphs and charts in my high school days but I still couldn’t make anything out of the jargon I saw on my screen. But soon, with learning and practicing, I got the hang of it.
A trading chart is a visual representation of the buying and selling patterns of traders (buyers/demanders and sellers/suppliers) in the market and the prices at which they sold or bought a commodity, it shows how they moved price from one point to another in the past as well as their current price activity happening in real time.
KEY TAKEAWAY: Learning technical analysis helps you to trade any market that has historical price charts (Forex, indices, cryptocurrencies, stocks etc.) and its major idea is the analysis of the market’s forces of demand and supply (buying/selling)
DEMAND: Say you want to buy salt, you are demanding salt, you need salt, salt has value to you and anything that has value usually has a high price. If more people demand for salt, the price of salt automatically starts increasing. This is especially due to:
i. SCARCITY; there may not be enough salt to go round for the many people demanding for it, it then boils down to a game of who has the most need for salt, who is salt most valuable to and how high are they willing to pay to get it?. This is what happens when the price of a digital currency/asset increases in value and price. The more people demanding for it, the higher the price becomes.
SUPPLY: If you then want to sell your salt, you are supplying it to the person(s) interested in buying it from you, you don’t need the salt anymore may be due to some reasons; you prefer the money to salt, you have plenty of salt than you can do with, you’d like to buy something else, (you tell me). At the end of the day, it all boils down to the fact that the salt doesn’t really have much value to you, and anything that has no value usually has a low price. If more people supplies their salt, the price automatically starts decreasing. This is especially due to:
ii. LACK OF SCARCITY: There may be just too much of salt in the market if everybody decides to sell (supply) their salt and soon salt would be almost useless since nobody wants it. When the price of a digital currency/asset decreases, it is usually due to the fact that a lot of people are selling it out because at that point they have no value for it.
But price can’t move in one direction; upward (increase) or downward (decrease) forever, price would both increase and decrease at different periods in time, this is because as people are supplying, people are equally demanding, though the demand may be higher than the supply sometimes and vice versa. This upward and downward change in price movement is what causes resistance and support in price charts.
RESISTANCE: Literally, resistance opposes motion, this simply means it tries to stop movement. In technical analysis, resistance tries to stop the upward (increasing) movement of prices.
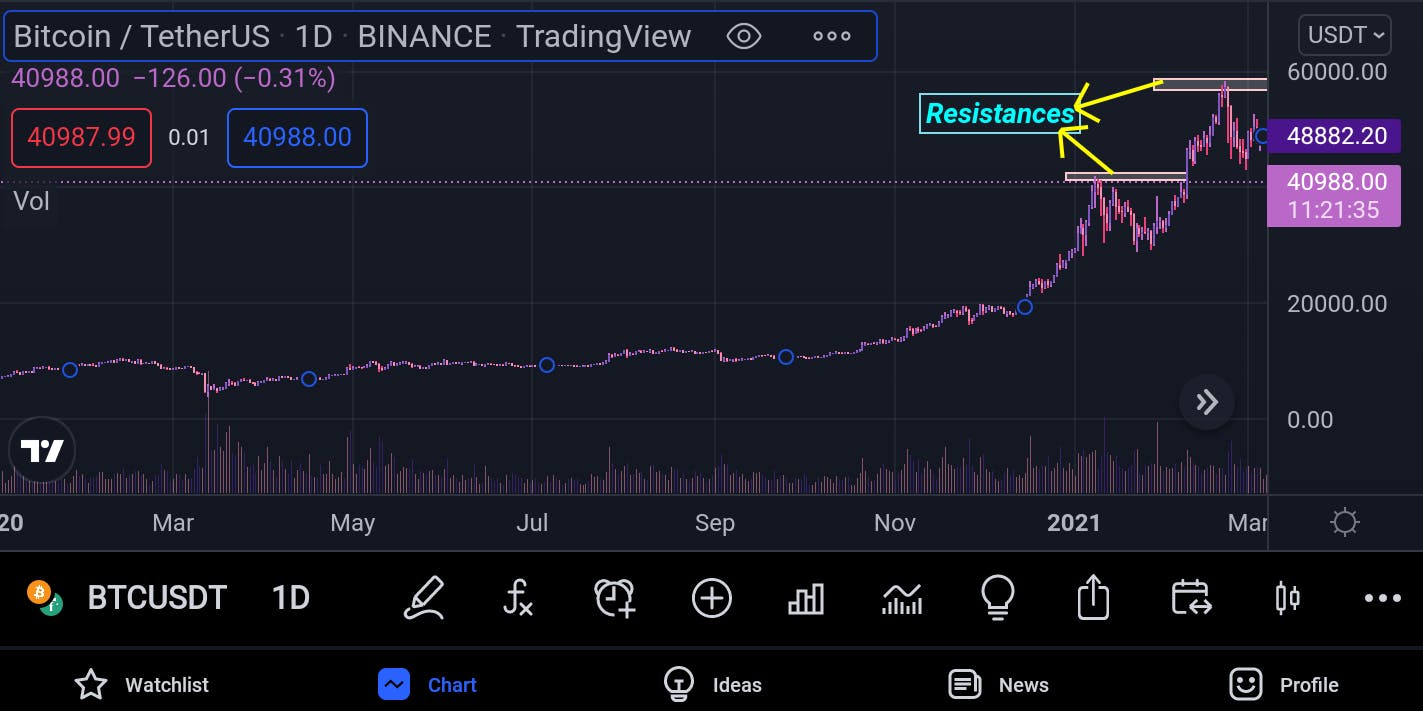 What this means is that the sellers in the market are stronger than the buyers at that point and as they keep selling/supplying, the price would start decreasing. (Usually, when price gets to this point in the chart, it stops and tends to start moving downward)
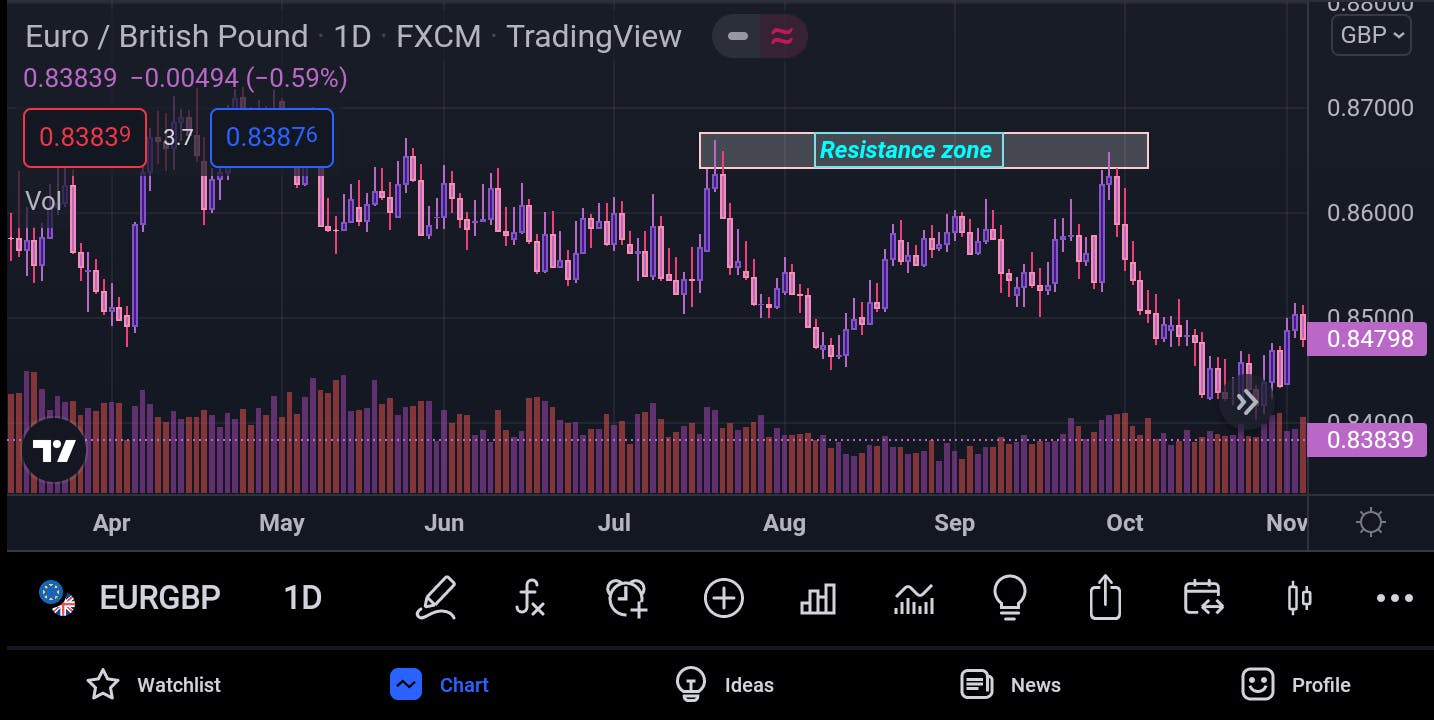
iii. RESISTANCE/SUPPLY ZONE: If price touches a particular point of resistance at least twice and goes down, it makes that point a resistance zone, it means that sellers literally stay at that zone, waiting to sell off and push price downwards. It is basically caused by excessive supply
SUPPORT:
Literally, support gives something the balance to keep it from falling and to find support means to find the needed help, strength and courage to continue going forward (upward). In technical analysis, support tries to stop prices from going any lower by giving it the strength to start going upwards
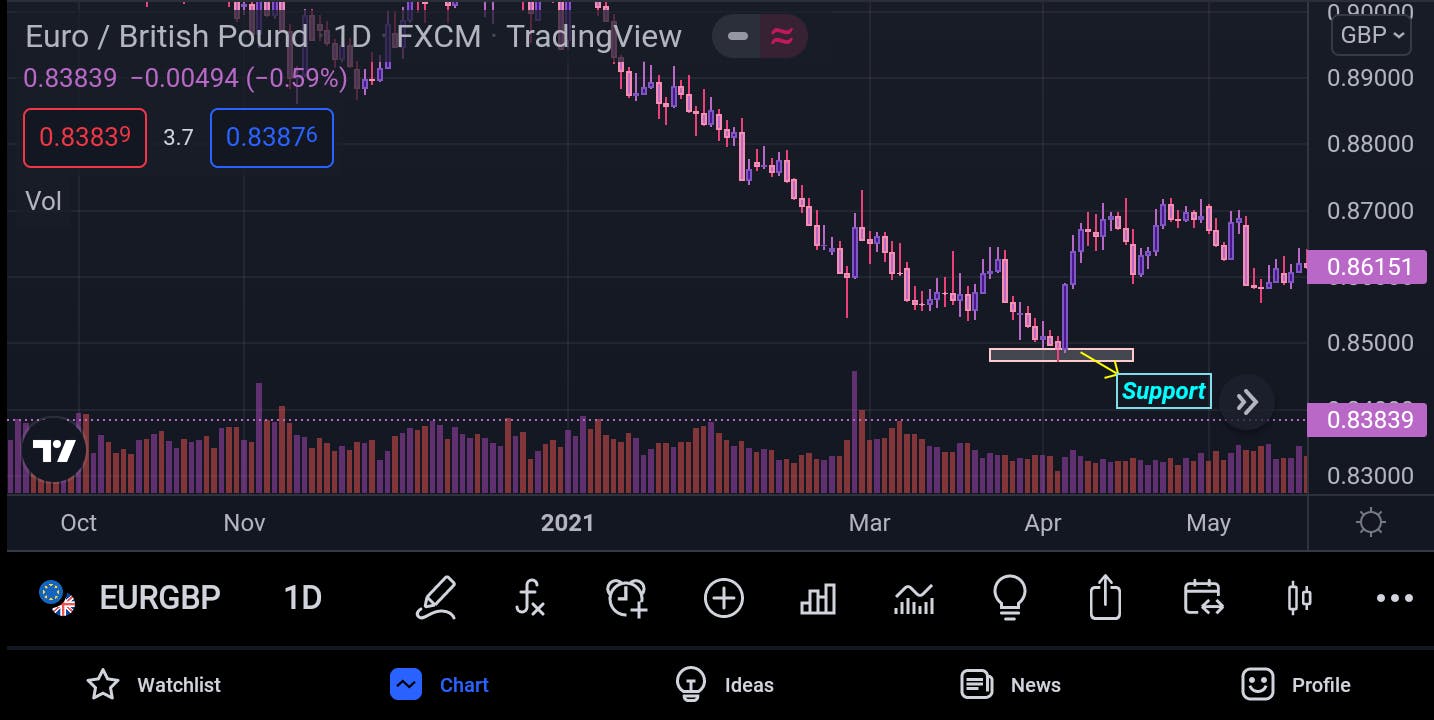 what it implies is that at that very point, the buyers in the market becomes stronger then the sellers and as they keep demanding, buying and adding value to the asset, price start increasing. (price starts moving upward in the chart when it gets to this point)
iv. (SUPPORT/DEMAND ZONE): To be sure that there’s a support zone in the chart, price has to make an upward movement when it touches a point of support at least twice as this would confirm that the buyers are waiting there patiently to buy more and push price upwards. It is basically caused by excessive demand
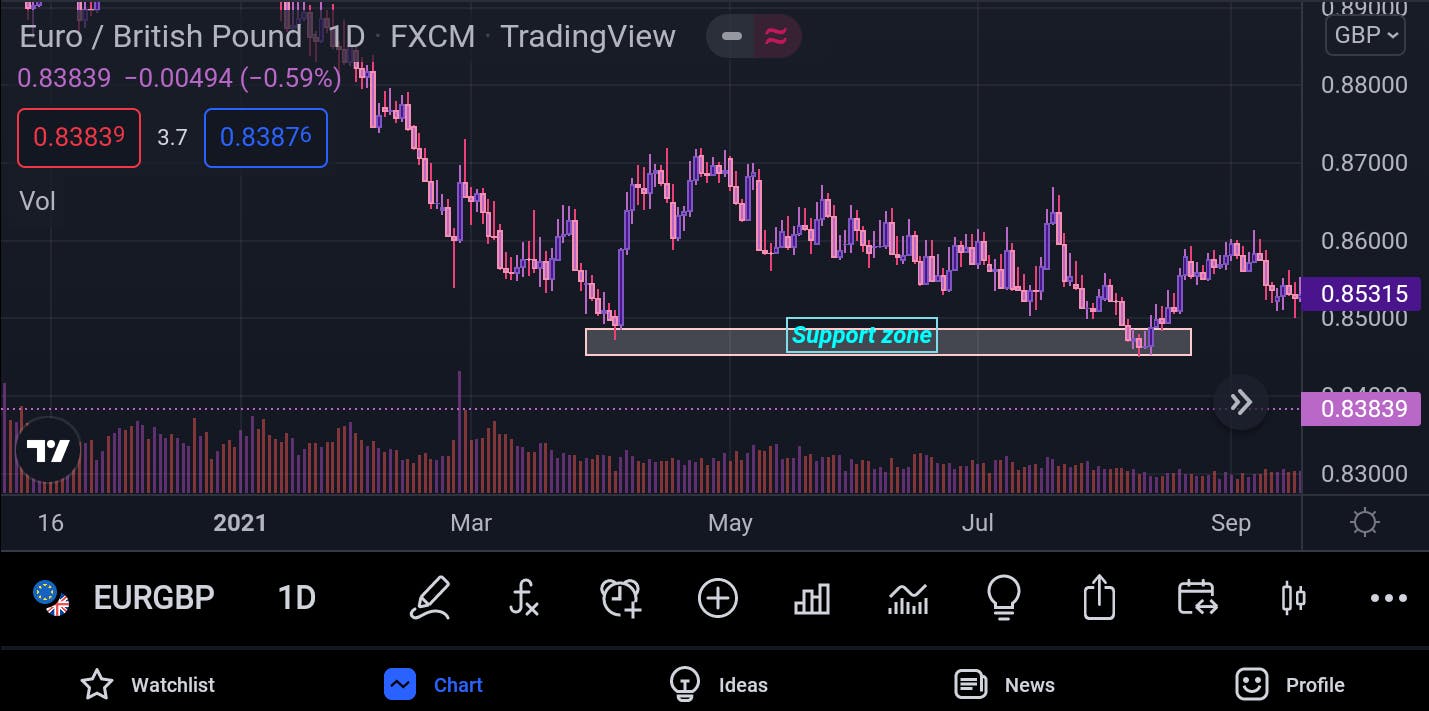
EXERCISE: Look at a number of trading charts and try to identify the resistance and support points and zones.
WATCH OUT: I may turn this into a series, to turn a complete beginner into a profitable technical analyst and trader!